東京女子医科大学英語2012年第3問
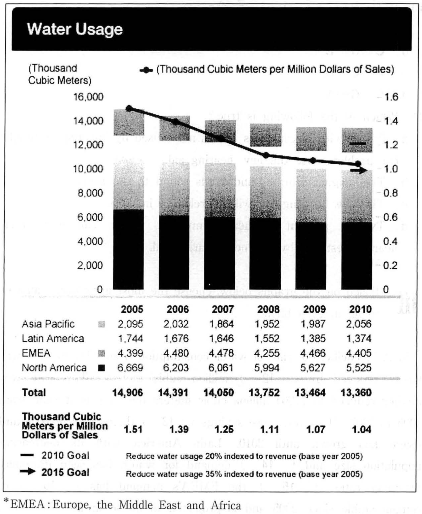
In Asia Pacific, the rate of water consumption from 2005 to 2006 was vastly reduced by ( 12 ) million cubic meters. This rate was further reduced to 1.864 million cubic meters the very next year, from 2006 to 2007. However, these savings ( 13 ) themselves in 2008 and usage has grown until 2010. Latin America, with its decreasing population size and ( 14 ) demand for water, has seen gradually dropping rates. ( 15 ), the EMEA's demand has ( 16 ) to remain stable since 2005 and is projected to do so in the ( 17 ). Back across the pond, in North America, water usage has been impressively dropping off since 2005. Since this region has ( 18 ) decreased its annual rate, it has been both ( 19 ) and awarded for its strong programs to reduce usage and to conserve water. Altogether, the global targets for water usage have been ( 20 ) every year, and analysts hope that they will drop ( 21 ) the 10 million mark by 2015.
-
-
12.
- a. 0.063
- b. 0.63
- c. 6.3
- d. 63
-
-
13.
- a. divided
- b. reserved
- c. reversed
- d. stabilized
-
-
14.
- a. declining
- b. expanding
- c. increasing
- d. steady
-
-
15.
- a. Although
- b. In fact
- c. Meanwhile
- d. Therefore
-
-
16.
- a. continued
- b. declined
- c. expected
- d. leaned
-
-
17.
- a. century
- b. future
- c. past
- d. place
-
-
18.
- a. consistently
- b. randomly
- c. rarely
- d. sometimes
-
-
19.
- a. alarmed
- b. alerted
- c. annoyed
- d. applauded
-
-
20.
- a. challenged
- b. ignored
- c. maintained
- d. met
-
-
21.
- a. above
- b. below
- c. in
- d. with