東海大学英語2013年第6問
次のグラフを見て、英文の空所(1)~(4)に入る最も適切なものを、それぞれア~エの中から一つ選びなさい。
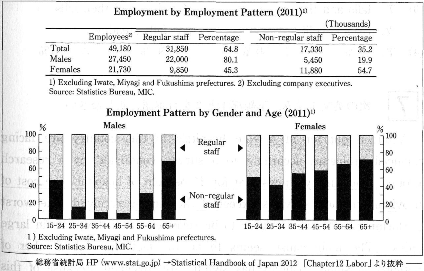
The upper table shows the employment pattern for male and female employees in Japan. Overall, approximately two-thirds of (1)( ). The chart also indicates that the number of regular male staff members is (2)( ) the number of non-regular male staff members.
The two lower graphs show the changes in employment patterns according to age and gender. From the age of 25-34 to 65 and over, the percentage of females employed as non-regular staff (3)( ). The percentage of males employed as non-regular staff tends to rise later in life. After the age of 65, approximately (4)( ) of male employees are no longer regular staff members.
- (1)
- ア. total employees are classified as regular staff
- イ. total employees are classified as non-regular staff
- ウ. male employees are classified as non-regular staff
- エ. female employees are classified as regular staff
- (2)
- ア. slightly greater than
- イ. much greater than
- ウ. slightly less than
- エ. much less than
- (3)
- ア. falls and then rises
- イ. rises and then falls
- ウ. rises steadily
- エ. falls steadily
- (4)
- ア. 10%
- イ. 30%
- ウ. 50%
- エ. 70%